The Best Way to Learn SQL in 2026 (That Actually Sticks)
There’s no shortage of SQL courses. There is a shortage of honest advice about what order to learn it in — and why most people plateau before they get good.
The most common SQL learning experience goes like this: you finish a course, feel confident, open a real database, and freeze. The data is messy. The questions are vague. Nobody is telling you which table to look at. The course didn’t prepare you for any of this.
That’s not a you problem — it’s a curriculum problem. Most SQL courses teach syntax. Almost none of them teach you how to think like an analyst. And that gap is where most people get stuck.
Here’s the approach that actually works — built around the order that builds real understanding, not just the ability to pass a quiz.
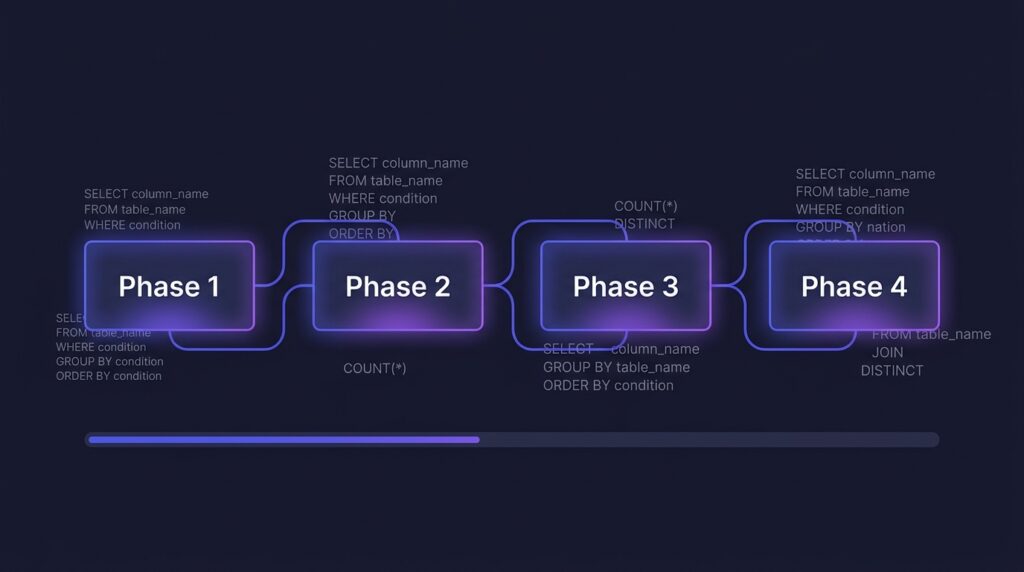
The 4-Phase Roadmap
Start with the core building blocks: SELECT, FROM, WHERE, ORDER BY, LIMIT. These five clauses will get you further than you think. But here’s the critical part — practice them on a real dataset from day one, not toy examples.
Find a dataset you’re genuinely curious about. Sports stats, e-commerce orders, music streaming data — anything that makes you want to ask questions. Curiosity is what makes SQL stick.
- SELECT, FROM, WHERE, ORDER BY, LIMIT
- Filtering with AND, OR, NOT, IN, BETWEEN, LIKE
- Basic aggregations — COUNT, SUM, AVG, MIN, MAX
- GROUP BY and HAVING
- NULL handling — IS NULL, IS NOT NULL, COALESCE
SQLZoo and Mode Analytics SQL Tutorial are both free, browser-based, and use real datasets. No setup required — just open and start writing queries.
Real data lives across multiple tables. The ability to join them correctly — and understand what happens when a join goes wrong — is what separates someone who learned SQL from someone who can use it.
Most beginners learn INNER JOIN and stop there. But LEFT JOIN is probably the most important join in analytics — it’s how you find things that are missing, customers who haven’t purchased, campaigns with no conversions.
- INNER JOIN — only matching rows from both tables
- LEFT JOIN — all rows from the left table, NULLs where no match
- RIGHT JOIN — the mirror of LEFT (rarely used in practice)
- Joining on multiple conditions
- Self joins — joining a table to itself
Think of INNER JOIN as an intersection — only what’s in both. Think of LEFT JOIN as “keep everything on the left, fill in what matches on the right, leave NULLs where nothing matches.”
This is where SQL gets powerful. CTEs (Common Table Expressions) let you break complex queries into readable steps — like writing clean, documented code instead of one giant nested mess. Window functions let you calculate running totals, ranks, and period-over-period comparisons without collapsing your data into groups.
- Subqueries in SELECT, FROM, and WHERE clauses
- CTEs with WITH — writing readable multi-step queries
- ROW_NUMBER, RANK, DENSE_RANK — ranking within groups
- SUM OVER, AVG OVER — running totals and moving averages
- LAG and LEAD — comparing a row to the previous or next row
- NTILE — dividing rows into buckets (used in RFM analysis)
In a real job, you’ll write queries that other people need to read and maintain. CTEs make your logic transparent. A recruiter reviewing your portfolio can tell immediately whether you write clean, readable SQL — or one giant unreadable subquery chain.
This is where everything consolidates. Take a real public dataset and answer 8–10 genuine business questions using everything you’ve learned. Don’t follow a tutorial — come up with the questions yourself. What would a manager actually want to know about this data?
Then write it up. Document your queries, share your findings, put it on GitHub. This is your portfolio — and it’s worth more than any certificate.
Maven Analytics, Kaggle, and the Google BigQuery public datasets are all excellent. Pick something with multiple related tables so you’re forced to use JOINs and CTEs — not just a single flat file.
The Myths That Slow People Down
You don’t. The best way to learn SQL is to have a question you actually want to answer, then figure out how to answer it. Courses are references, not prerequisites.
No working analyst has every function memorised. You need to understand the concepts well enough to know what to look up. Google is a tool, not a crutch.
A portfolio of projects on real data proves SQL skills. Certificates prove you paid for a course. Employers know the difference — especially at the analyst level.
The Best Free Resources in 2026
The Honest Timeline
With consistent practice — say, 45–60 minutes a day — most people can reach job-ready SQL in 8–12 weeks. That means comfortable with JOINs, CTEs, window functions, and able to write queries against an unfamiliar database without panicking.
The people who get there faster are the ones who spend less time watching tutorials and more time writing queries that break, debugging them, and understanding why they broke. There’s no shortcut to that loop — but there’s also nothing more effective.
Start with a dataset you’re curious about. Write a bad query. Fix it. Repeat.
My SQL project portfolio covers e-commerce analysis, product growth analysis, and full retail analytics — all built using exactly this progression. Check out the Projects page to see what Phase 4 looks like in practice.