From Excel to SQL: How to Make the Switch (Without Starting Over)
You already know more SQL than you think. Here’s how to use your Excel knowledge as a bridge — not a barrier — when making the switch to SQL.
If you’ve spent years in Excel, switching to SQL can feel disorienting — not because the concepts are foreign, but because the interface is completely different. You go from clicking cells to typing queries. From one big flat sheet to multiple connected tables. From results you can see immediately to a blank editor waiting for you to describe what you want.
That disorientation is normal. And it’s temporary. Because almost everything you do in Excel has a direct equivalent in SQL. The logic is identical. The syntax is different. Once you see the mapping clearly, the switch stops feeling like starting over and starts feeling like learning a second language when you already know the first one.
This is that translation guide — written specifically for people who know Excel and want to make the switch to SQL without losing their minds in the process.
What Excel Already Taught You About SQL
Before we get to the differences, let’s acknowledge what you already know. If you’ve used Excel seriously, you understand:
- Filtering data — you’ve used AutoFilter to show only rows that meet a condition
- Grouping and aggregating — pivot tables group rows and calculate SUM, COUNT, AVERAGE
- Joining data — VLOOKUP and INDEX/MATCH pull data from one table into another
- Sorting — you’ve sorted columns ascending or descending
- Conditional logic — IF statements apply different logic based on a condition
- Working with dates — YEAR(), MONTH(), DATEDIF() extract parts of dates
Every single one of these has a direct SQL equivalent. You’re not learning new concepts — you’re learning new syntax for concepts you already use every day.

The Excel-to-SQL Translation Table
Here’s every major Excel operation mapped to its SQL equivalent. Keep this open while you’re learning — you’ll use it constantly.
| What you want to do | In Excel | In SQL |
|---|---|---|
| Choose which columns to show | Hide/unhide columns | SELECT col1, col2 |
| Filter rows by a condition | AutoFilter / IF | WHERE condition |
| Sort rows | Sort A→Z or Z→A | ORDER BY col ASC/DESC |
| Count rows | COUNTA() / COUNTIF() | COUNT(*) / COUNT(col) |
| Sum a column | SUM() / SUMIF() | SUM(col) |
| Average a column | AVERAGE() / AVERAGEIF() | AVG(col) |
| Group and aggregate (pivot) | Pivot Table | GROUP BY + aggregate |
| Pull data from another table | VLOOKUP / INDEX MATCH | JOIN |
| Conditional column value | IF(condition, a, b) | CASE WHEN condition THEN a ELSE b END |
| Handle blank/null values | IFERROR() / ISBLANK() | COALESCE() / IS NULL |
| Extract year from date | YEAR(date) | YEAR(date) |
| Limit number of results | Show top N rows manually | LIMIT N |
Some functions are literally identical — YEAR(), MONTH(), SUM(), COUNT(). SQL didn’t reinvent the wheel. It just put the logic in a different place on the page.
The Mental Model Shift — This Is the Hard Part
The syntax translation is easy. The harder shift is conceptual — and it’s the reason most Excel users feel lost at first.
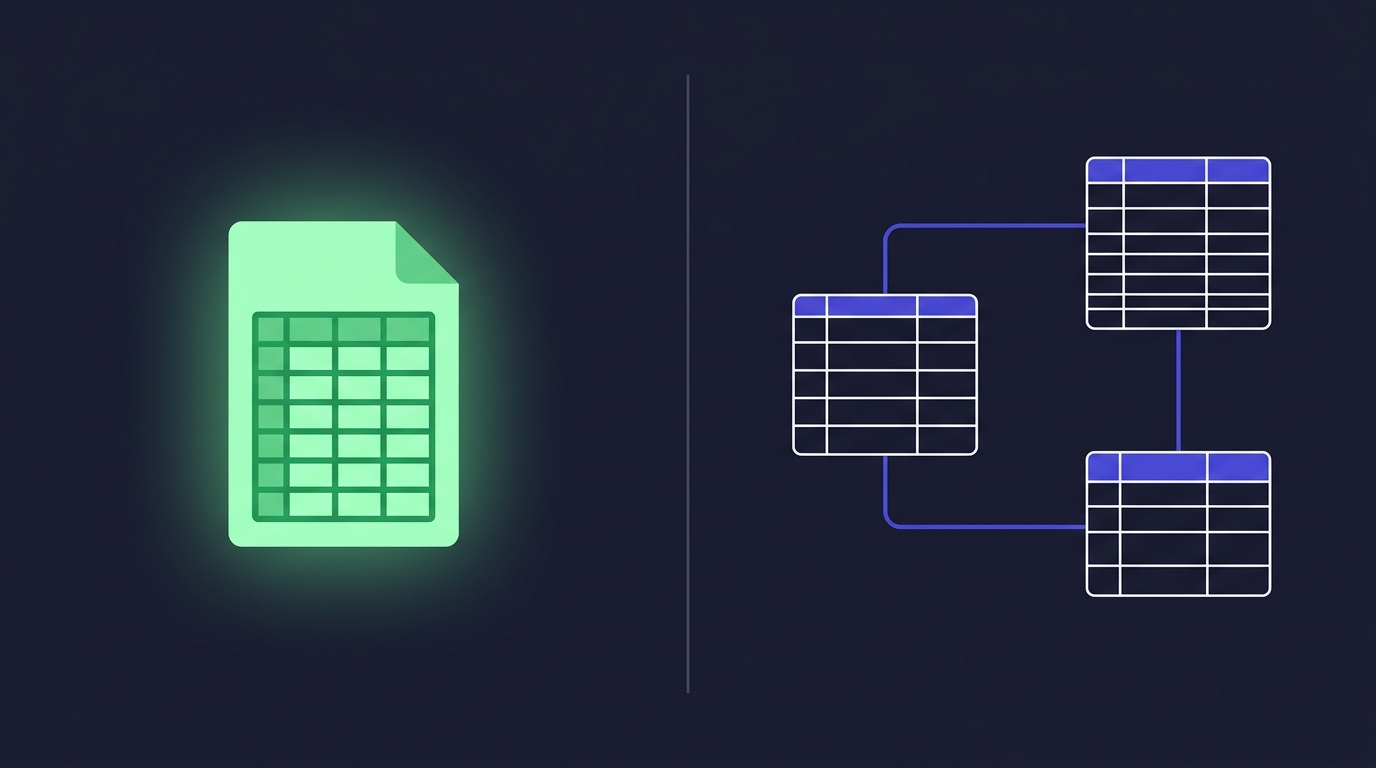
In Excel, you work with one big flat sheet. All your data is visible in one place. You can scroll to any cell, click on it, and see exactly what’s in it. The data and the analysis live in the same place.
In SQL, your data lives across multiple related tables. You never see all the data at once — you write a query that describes what you want, and the database figures out how to retrieve it. You’re not manipulating cells. You’re writing instructions.
I can see all my data. I click on cells and modify them directly. My analysis lives in the same spreadsheet as my data. I work top-down, row by row.
My data lives in tables I can’t directly modify. I write queries that describe what I want. The database retrieves it. I work by asking questions, not clicking cells.
This mindset shift is why Excel users often feel like beginners again when they start SQL — even though their analytical thinking is exactly the same. Give it two to three weeks of consistent practice. It clicks.
Side-by-Side: Excel vs SQL for Common Tasks
Let’s make this concrete. Here are four common analytical tasks done in both Excel and SQL.
Task 1 — Filter to completed orders only
Click the dropdown on the Status column → deselect everything except “Completed” → click OK.
Write WHERE status = ‘completed’ in your query.
SELECT *
FROM orders
WHERE status = 'completed';
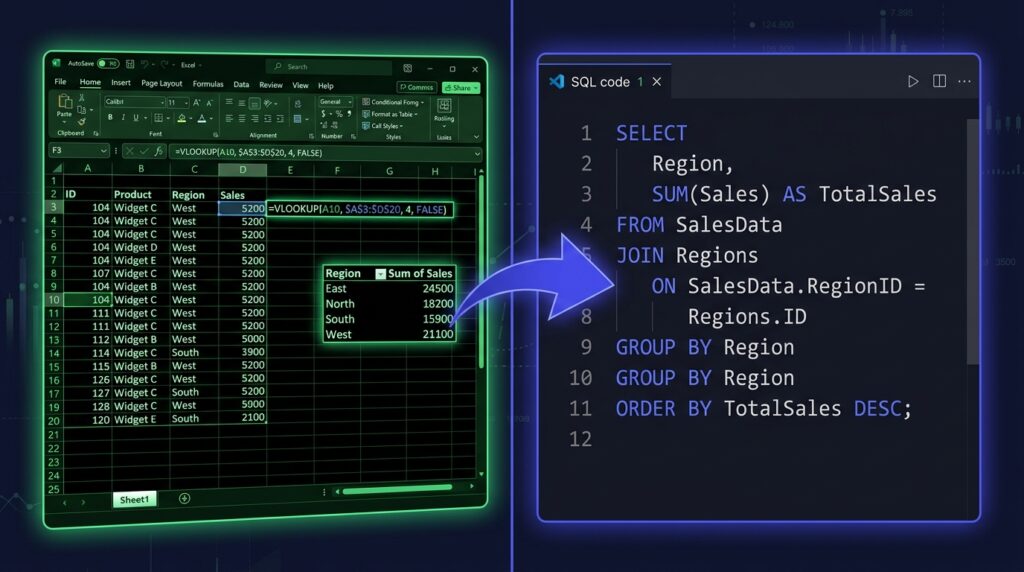
Task 2 — Total revenue by product category (pivot table)
Insert → PivotTable → drag Category to Rows, Revenue to Values, set to SUM.
GROUP BY category with SUM() aggregation.
SELECT
    category,
    SUM(revenue) AS total_revenue
FROM orders
GROUP BY category
ORDER BY total_revenue DESC;
Task 3 — Pull customer name from another table (VLOOKUP)
=VLOOKUP(A2, customers!A:B, 2, FALSE) — looks up customer_id in the customers sheet and returns the name.
JOIN the customers table on customer_id and SELECT the name column.
SELECT
    o.order_id,
    o.order_total,
    c.customer_name  -- pulled from customers table, like VLOOKUP
FROM orders o
LEFT JOIN customers c ON o.customer_id = c.customer_id;
VLOOKUP only returns a match if it finds one — unmatched rows show #N/A. LEFT JOIN keeps all rows from the left table and fills NULL where there’s no match. That NULL behaviour is actually more useful — it lets you find orders with no matching customer record, which VLOOKUP would just hide.
Task 4 — If/else conditional column
=IF(C2>1000, “High Value”, “Standard”) — labels each row based on order total.
CASE WHEN order_total > 1000 THEN ‘High Value’ ELSE ‘Standard’ END
SELECT
    order_id,
    order_total,
    CASE
        WHEN order_total > 1000 THEN 'High Value'
        WHEN order_total > 500  THEN 'Mid Value'
        ELSE 'Standard'
    END AS customer_tier
FROM orders;
What SQL Does That Excel Can’t
Once the mindset shift happens, you start to see why SQL exists — there are things it does that Excel simply can’t handle well.
Excel starts to struggle at around 100,000 rows. It slows down, formulas become fragile, and sharing large files becomes a nightmare. SQL databases handle millions — sometimes billions — of rows without breaking a sweat.
- Scale — SQL handles millions of rows as easily as thousands. Excel does not.
- Reproducibility — A SQL query is a documented, repeatable process. An Excel model with dozens of formulas is a fragile, hard-to-audit mess.
- Multiple tables — SQL is designed for relational data. Excel handles multiple sheets with VLOOKUP — which breaks constantly.
- Version control — SQL queries can be saved to GitHub and tracked over time. Excel files get emailed around as “final_v3_FINAL_USE_THIS_ONE.xlsx”.
- Collaboration — Multiple people can query the same database simultaneously. Only one person can edit an Excel file at a time without chaos.
Your Excel-to-SQL Learning Path
Given that you already know Excel, here’s the fastest path through SQL — skipping the things you already understand conceptually and focusing on what’s genuinely new.
Download MySQL Workbench (free) and practice on a sample database. Alternatively, SQLZoo runs entirely in your browser with no setup required — ideal for the first week.
The Mistakes Excel Users Make When Learning SQL
A few patterns come up almost every time someone transitions from Excel to SQL:
Excel users often try to build the same flat, all-in-one spreadsheet structure in SQL. Don’t. SQL is relational — embrace the multiple-table structure instead of fighting it. Your data model will be cleaner and your queries faster.
In Excel you can click a cell and type a new value. SQL queries are read-only by default — SELECT queries never change your data. This is a feature, not a bug. Your source data is always safe.
Excel users often write subqueries trying to replicate VLOOKUP behaviour. A LEFT JOIN is almost always the cleaner, faster answer. If you’re thinking “I need to look this up from another table” — write a JOIN.
You’re Closer Than You Think
The Excel-to-SQL transition feels harder than it is — not because the concepts are foreign, but because the interface is. You’re used to clicking. SQL makes you type. That’s the real adjustment.
But the analytical thinking you’ve built in Excel — filtering, grouping, joining, conditional logic — transfers completely. You’re not starting over. You’re translating. And once the translation clicks, SQL starts to feel like a superpower that Excel was always trying to be.
Keep the translation table in this post bookmarked. Come back to it whenever something in SQL feels unfamiliar. Chances are you’ve done it in Excel before — you just need to find the equivalent.